Monitoring can provide you with detailed insights on the usage and performance of your application.
The hard part about monitoring is finding out which measurements are most interesting, for you as a developer, or your client.
The easy part is setting up the tools and integrating monitoring into your application.
Setting up the tools
The tools we use at Marlon are StatsD and Graphite.
StatsD
StatsD is a network daemon, running on Node.js, that listens for statistics. The stats are sent from the application over UDP (fire and forget). StatsD supports different types of stats:
- counters: send increments from your application
- timers: time important business parts of your application
- gauges: arbitrary values
Before sending the stats to a backend (every defined flushInterval), StatsD aggregates the received values. Counters will have their individual values summed, others will be averaged.
StatsD’s default flushInterval is set to 10 seconds. Depending on the type of applications you are monitoring, you might want to adjust this interval. We work with a 30 second interval.
Graphite
Graphite is the backend whereto StatsD flushes its aggregated data every flushInterval. The flood of monitoring data can be controlled by defining retention schemas. This way, you can have Graphite keep track of your data as granular as possible on short term, and have it aggregated for long term storage.
Configuration
The following conf/storage-schemas.conf detects stats named stats.<anything> and will store 30 second data for 6 hours, 1 minute data for 14 days and 10 minute data for 5 years:
[stats]
pattern = ^stats.*
retentions = 30s:6h,1m:14d,10m:5y
How the data is being aggregated when using a next retention level can be configured in conf/storage-aggregation.conf (default is average).
When using counters, you will have to configure an entry here that matches you counter stats name. (here: every stat named <anything>.count.
If you do not define a specific aggregation schema for your counters, the values will be averaged resulting in incorrect aggregated data.
[sum]
pattern = \.count$
xFilesFactor = 0
aggregationMethod = sum

[default_average]
pattern = .*
xFilesFactor = 0.3
aggregationMethod = average
Show me the graphs!
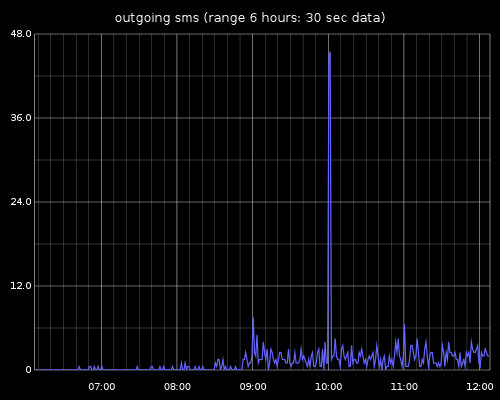
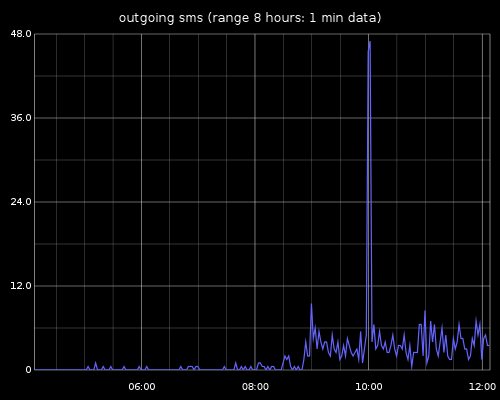
When rendering graphs in Graphite, you might want to keep your defined retention rules in mind. This means that, with the above configuration, when you look at a graph with a relative time range greater than 6 hours, your data will automatically be rendered per minute.
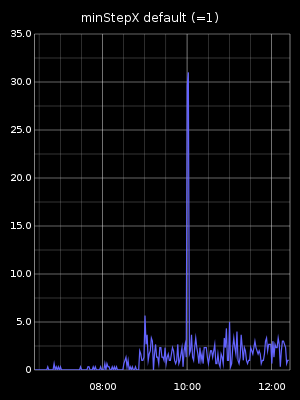
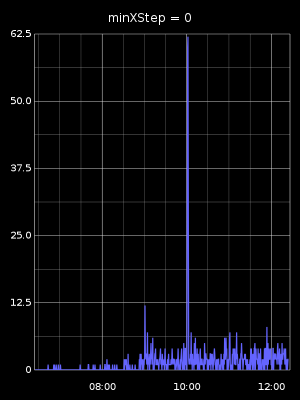
When looking closely at some of the graphs we were rendering, we noticed that sometimes the data rendered in the PNG graph did not correspond to the actual datapoints. The reason was the default minXStep parameter used when rendering a graph. This parameter sets the minimum pixel-step used when drawing datapoints. This means that datapoints are skipped when they are to be drawn too closely next to each other. Setting this parameter to zero renders all datapoints and renders a correct (though sometimes smooshy) graph. To avoid this behaviour, render a larger graph using the width/height parameters, or adjust your retention schemas if you do not really need such level of granularity.
/render?width=300&from=-6hours&until=-&height=400&target=stats_counts.stats.m4-core.production.sms.outgoing.success&_uniq=0.4623039819178113&title=minStepX default (=1)&hideLegend=1

/render?width=300&from=-6hours&until=-&height=400&target=stats_counts.stats.m4-core.production.sms.outgoing.success&_uniq=0.4623039819178113&title=minXStep = 0&hideLegend=1&minXStep=0
You can easily use your own graph rendering engine with the data Graphite provides. Using the format URL parameter, you can choose to receive the available data in JSON, CSV, …
Monitoring integration into your application
StatsD PHP is a small PHP library which can be easily integrated. Monitoring your application is as easy as defining a default monitoring host and application namespace and you’re off to go:
\StatsD\StatsD::setDefaultHandler(new \StatsD\UdpHandler($config->monitoring->host));
\StatsD\StatsD::setDefaultNamespace($config->monitoring->namespace); // ex.: some-application.production
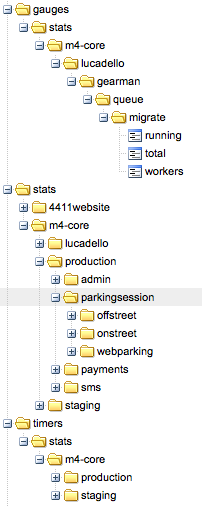
The namespace you define in StatsD should differ per application. Graphite will create these namespaces automatically in its graphical interface. Dots in stats names will translate in a folder in the Graphite interface. Once your monitoring environment is set up, there is zero configuration for your next application.
Adding a new location where you want to track your application requires one line of code and a originally chosen measurement name:
Increment a counter stat: (mind the .count suffix, resulting in aggregated data using sum)
\StatsD\StatsD::getInstance()->increment('my-little-pony.jumps.count');
Timer stat:
\StatsD\StatsD::getInstance()->time('my-little-pony.brush_hair', $timeInMilliseconds);
More details on using the StatsD PHP library can be found in its repository. Libraries for other languages can be found in the original Etsy’s StatsD repository.
It’s fun!
Monitoring is fun, seriously. As a developer, you can actually see your application being used. You can easily track errors and/or performance after new releases and when implementing new functionality, you should integrate measuring points from the start.
No matter what project your are currently working on, it’ll pay off.